Reports Icons
Migration notice: This page was converted from the legacy TO3000 3D CHM. Classification: KEEP. Legacy wording is evidence only — verify against current TO3000 7.1 / qa before treating as authoritative.
The Reports Ribbon is separated into several tabs for different kinds of reports, and each icon represents a specific report template.
The Clients tab
Contains Static Reports showing the total funds invoiced by clients.
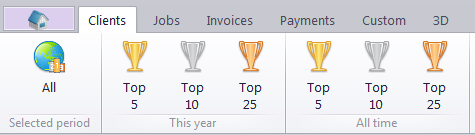
The All report adds up invoices within the period specified by the Global Date Filter.
The Top 5/10/25 reports each come in two versions: This year and All time. They show the indicated number of clients with the greatest total invoices over either the current year or across the entire database. They also show the overall percentage of the displayed clients’ invoices in your gross revenue.
The Jobs tab
Contains static reports relating to Job productivity, Incomes and expenses, and service sales. All reports on the tab except Sales History and Sales by service are affected by the Global date filter.
|  Jobs Chart | A bar diagram showing the monthly total volume of jobs created for a specific client |
|---|---|
|  Jobs Table | Similar to Jobs Chart, but presented as a table. |
|  Total Volume of Completed Jobs | A table showing the total volumes of completed jobs, with columns representing months and rows representing volume units. |
|   Income and Expense Report #1 and #2 | Tables showing monthly incomes and expenses, and totalling them to arrive at the overall balance. The two reports differ mainly in layout. |
|  Sales Table | A table showing total sales for each month in the selected period. |
|  Client Sales Report | A table showing the total volume and sum value of each kind of unit sold to a particular client. |
|  Sales by units | A table showing the total volume and sum value of each kind of unit sold to all clients |
|  Total Sales by Clients | Contains separate tables for each client, with the total volume and value of each “Group/service/unit” combination sold to each client. |
|  Sales History Report by Clients | Shows the total volume and value of each unit type sold to each client over the entire history of the database. Not affected by the Global Date Filter. |
| .png) Sales chart | A bar diagram showing the total monthly sales over the selected period. |
|  Sales History chart | A bar diagram showing the total monthly sales over the entire history of the database. Not affected by the Global Date Filter. |
|  Sales by Service | A pie diagram showing the percentage of specific services in the total sales volume. Not affected by the Global Date Filter. |
The Invoices tab
Contains reports on performance and service distribution in terms of invoices.
 Customer ledger Customer ledger |
A table showing the total payments received from each client, further added up to totals in each currency and the grand total in the base currency. |
|---|---|
| .png) Income Report #1 | Shows a list of all payments issued over the selected period, with issue date and total in both client’s currency and base currency. |
| .png) Income Report #2 | A table of monthly payment totals from all clients, in the base currency. |
| .png) Sales chart | A bar diagram showing the total monthly sales over the selected period. |
|  Sales History chart | A bar diagram showing the total monthly sales (based on invoices) over the entire history of the database. Not affected by the Global Date Filter. |
The Payments tab
Contains reports on profits and service distribution in terms of payments.
|  Account Receivable | Shows the totals of expected payments from each client. Is not affected by the Global Date filter. |
|---|---|
| Customer ledger |
A table showing the total payments received from each client, further added up to totals in each currency and the grand total in the base currency. |
|  Invoice Register | Contains tables showing basic information on all invoices issued to each client (Date issued, Date due, number, value, linked value, currency). |
|  Outstanding Invoices | A table of all invoices, which have not been fully paid yet. Is not affected by the Global Date filter. |
| .png) Sales chart | A bar diagram showing the total monthly sales (based on payments) over the selected period. |
|  Sales History chart | A bar diagram showing the total monthly sales (based on payments) over the entire history of the database. Not affected by the Global Date Filter. |
The Custom tab
The Custom tab contains any additional reports added to the database via the Load function in the Advanced Settings>Reports window if the Backstage view.
The 3D tab
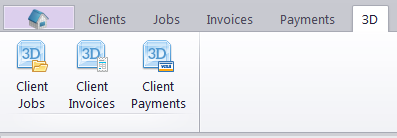
The 3D tab contains Dynamic Reports: presets for the Pivot Grid, which can be customized, sorted and filtered to display only the relevant information before being exported to any compatible format. Each of the three reports available has a unique set of fields which can be placed into the Pivot Grid. For more details, see the Dynamic Reports topic.

See also: